~blog
Demystified: the IPMI System Event Log
Introduction
IPMI is a useful tool for monitoring server hardware, and one of the features we’ll cover here is the System Event Log (SEL), which helps track system health. The SEL records events such as hardware failures (e.g., ECC errors, power supply failures), boot events, and sensor state changes.
In this article, we’ll look at the differences between the ipmitool sel list and ipmitool sel elist commands, and how each presents SEL data in different formats. We’ll also explore raw IPMI commands for accessing log entries directly and explain how to decode the raw output with some examples.
ipmitool sel list vs ipmitool sel elist
The ipmitool sel list command is used to list SEL entries. It provides an overview and summary of each entry. The output is concise and includes several pieces of information such as:
- Record ID: Identifier for each log entry
- Timestamp: Time when the event was logged
- Sensor Type / Sensor number: Sensor that generated the event
- Sensor state: Value interpreted based on the current event type
- Event Direction: Assertion/Deassertion event
e.g:
575 | 12/03/2024 | 11:27:10 | Module / Board #0x43 | Upper Critical going high | Asserted
Here, the information is pretty succint, some module on the board reached a critical value. But what is happening ?

Sometimes...
On the other hand, ipmitool sel elist includes a little more details about the events but it may not apply for every entries. This might a little more information about OEM events. Even it’s not possible to decode everything, it can give a a human readable hint about the sensor that triggered the event.
This includes:
- Decoded sensor number: Full name of the sensor that generated the event from SDR (Sensor Data Record)
- Context: depends of the event, may contains the reading of the sensor that triggered the event, the threshold, the severity etc..
e.g
575 | 12/03/2024 | 11:27:10 | Module / Board PWR_GB1_TOT_HSC | Upper Critical going high | Asserted | Reading 5865 > Threshold 5865 Watts
Now it is clear that the power sensor reached the critical threshold value but also the current reading of the sensor and the threshold value are 5865 Watts.
ipmitool raw and the SEL
The ipmitool raw command lets you send raw IPMI commands directly to the BMC and see the responses. We’ll use this to retrieve logs stored in the BMC’s non-volatile memory, but first, we need to understand how these commands are structured.
Querying the SEL with raw commands
When sending a command to the BMC, you need two key pieces: the NetFn and the CMD.
The NetFn (Network Function) is a command category that groups related operations, so the BMC knows what kind of task to perform. This tells the BMC which category of commands you’re using. There is a NetFn for sensors, power settings, storage and many more ! We’ll use the storage NetFn (code 0x0A) because it’s responsible for managing system logs, sensor data, and hardware inventory.
Each NetFn has specific sub functions called commands (CMD). For the netfn storage, these include:
- Write FRU Data (0x08): Writes hardware information to the FRU memory.
- Set SEL Time (0x49): Updates the timestamp for the logs.
- Get SEL Entry (0x43): Reads a specific log entry.
To read a log entry, we combine the Storage NetFn (0x0A) with the Get SEL Entry command (0x43). This tells the BMC to fetch data from the system event log stored in its memory.
Here’s what the raw command looks like:
ipmitool raw 0x0a 0x43 <args>
The code for the availables netfn and commands are in the Intelligent Platform Management Interface Specification 1:
- Network Function Codes: Table 5 (page 67)
- Sub-functions: Appendix H (page 615)
Using the IPMI specification table for the GET SEL Entry, we can retrieve any log entry by specifying its record ID. For example, let’s say we want to fetch the entire record for the entry with record ID 71h.
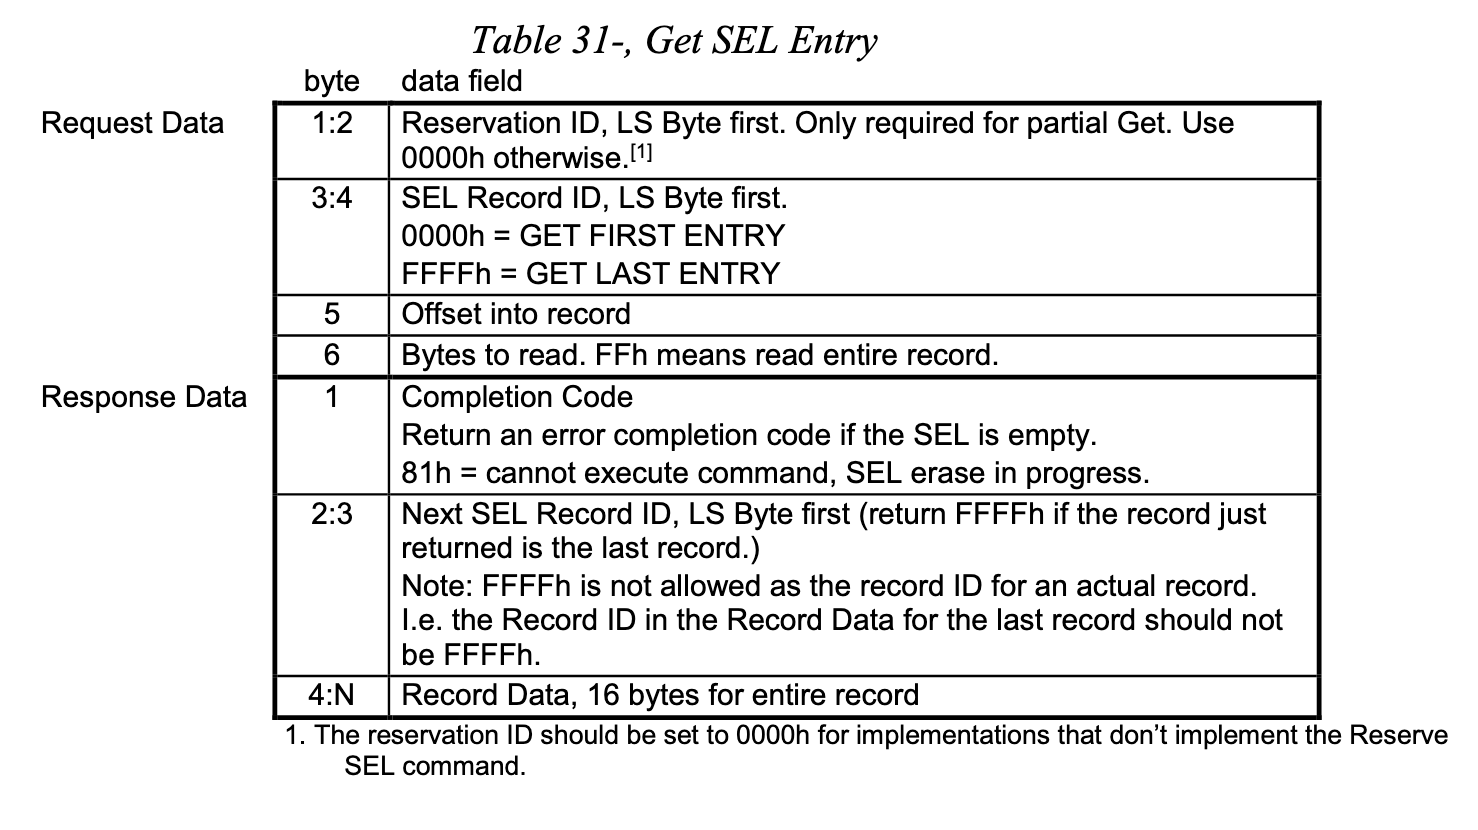
Which gives:
ipmitool raw 0x0a 0x43 0x00 0x00 0x71 0x00 0x00 0xff
Decoding the raw output
After running the command, we get the following raw output:
72 00 71 00 04 7d 48 31 67 20 00 04 09 ff 6f 00 00 00
Note: the completion code is not returned by ipmitool.
- [0:1] is 72 00, the next record ID, that is 72h
- [2:N] is 71 00 04 7d 48 31 67 20 00 04 09 ff 6f 00 00 00, as this is the record data, we need another documentation to decode it.

Then we could use the System Event Log (SEL) Troubleshooting Guide from Intel 2 to decode furthermore.

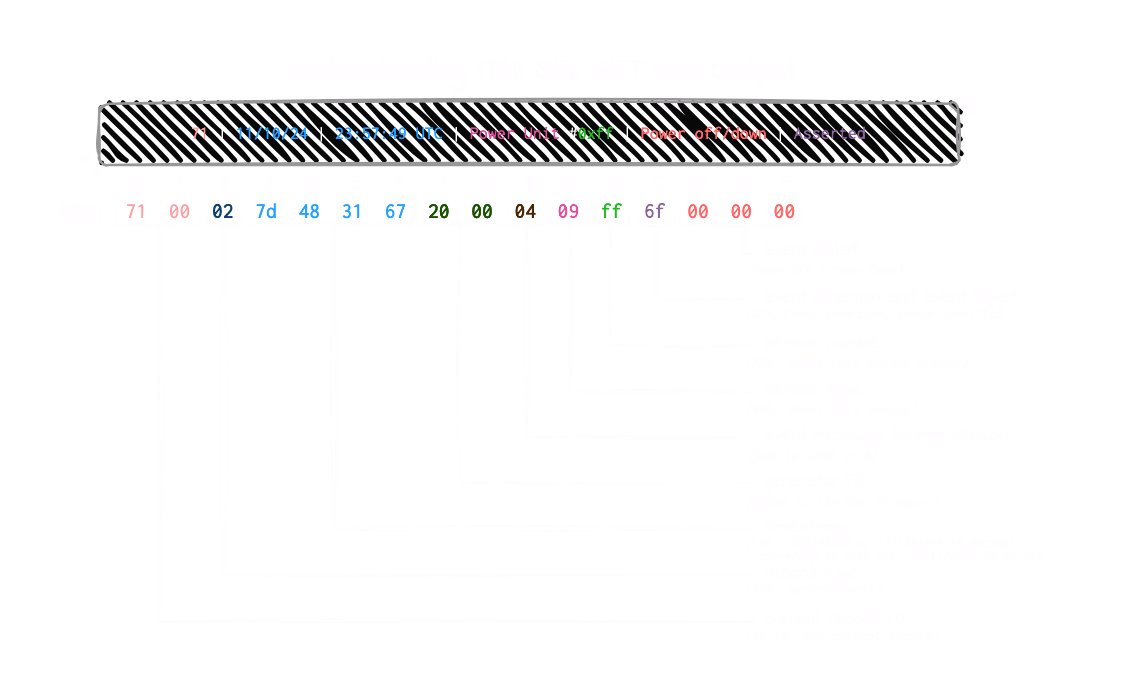
System Event Log (SEL) Troubleshooting Guide page 16
The event data can only be decoded after decoding the record type, sensor type, and event type. Both the record type and event type determine which decoding table to use. Additionally, they can indicate if the record is an OEM event, in which case you’ll need the manufacturer’s documentation to decode it.
For example, in our case, the record type is 02h, which indicates a system event (not OEM), so it should be easier to decode. The event type is 6Fh, and the event data is 00 00 00.
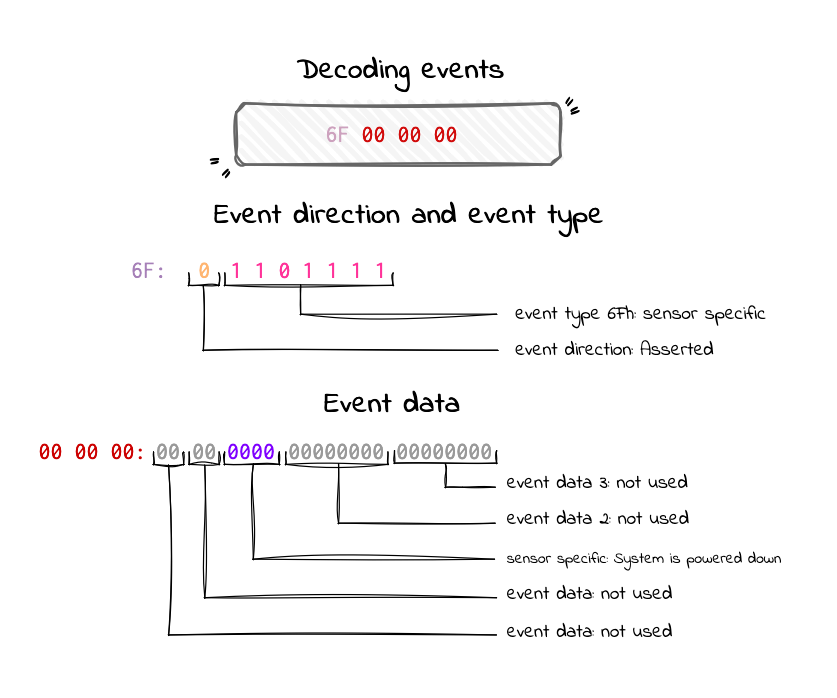
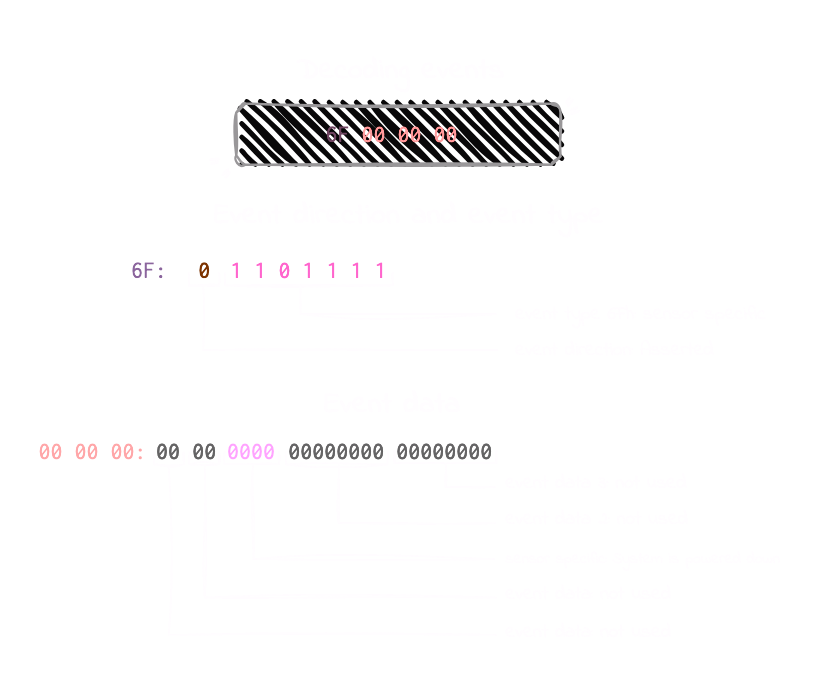
System Event Log (SEL) Troubleshooting Guide page 40
A case of OEM SEL record
Let’s start with this SEL entry, which doesn’t seem too helpful at first glance:
49b | 12/04/2024 | 12:00:13 | OEM record dc | 001647 | 00747a031678
Query the BMC for the full details using the command:
ipmitool raw 0x0a 0x43 0x00 0x00 0x9b 0x04 0x00 0xff
We get the following output:
9c 04 9b 04 dc 4d 44 50 67 47 16 00 00 74 7a 03 16 78
Now let’s break it down step by step:
- 9c 04: LSB First. Next SEL record ID: 49Ch.
- 9b 04: Bytes[1,2] LSB First. Current record ID: 49Bh.
- dc: Byte[3] Record type: OEM Timestamped.
Then, we decode the timestamp:
- 4d 44 50 67: Byte[4-7]: LSB First, which is 6750444Dh or 1733313613 in decimal, converted to date: 04/12/2024 12:00:13.
As this is an DCh OEM record, we’ll use the table 3 (SEL Troubleshooting page 18) to decode the next part:
- 47 16 00: Bytes[8-10]: LSB First. This is the Manufacturer ID. When decoded, 0x1647 corresponds to NVIDIA (ID 5703). The enterprise can be found on the IANA Enterprise Numbers registry from the manufacturer ID.
Since this is an OEM record, full decoding of bytes 11 to 16 requires the manufacturer’s documentation. Or, you know, just kindly ask them directly — here it seems that some RAM decided to give up and crash the server! ;)